


Do Public REITs Tell the Future of Property Values?
Wouldn't it be nice


"In the short run, the market is a voting machine, but in the long run, it is a weighing machine." - Benjamin Graham
Real estate moves slow.
Transactions can take months, so deal closed today reflect the price buyers and sellers agreed on two, three, four or more months ago.
So even “real-time” market data is always backwards looking.
If only there were a way to see into the future, data that hinted at where prices were going, rather than where they’ve been.
Well, there is.
Real Estate Investment Trusts, or REITs, are companies designed specifically for owning real estate. REITs come in both a public (trading on stock markets) and private (trading through private placement agents and brokers) flavors, and are owned by both institutions and individuals.
These instruments can be a great way to get exposure to real estate trends without the hassle and complexity of owning property directly, and have traditionally been a dividend-generating, slow-moving investment option.
But as real estate has gotten more volatile over the past couple decades, REITs have become a popular speculative instrument for investors betting on, say, the explosion in values of industrial property thanks to e-commerce.
The chart below shows historic price of Prologis (NYSE: PLD), the world’s largest owner of industrial property. And the yellow arrow shows the distinct increase in trading volume in the wake of the Great Financial Crisis (“GFC”).

From 2010 - 2022, Prologis stock increased over 10-fold, in addition to kicking off dividends to its shareholders.
And since the stock market is ultimately a tool for discounting future cash flow that reflects investor’s real-time view on a company or sector, REIT stocks can be useful tools for predicting the future of property values.
Or to put it differently, REIT pricing gauges the consensus view of investors in a particular real estate segment. Or to be even more specific, we can compare public REIT prices with private market property values.
And since REIT values react more quickly, they’re often considered leading indicators for the private markets.
Let’s consider some examples.
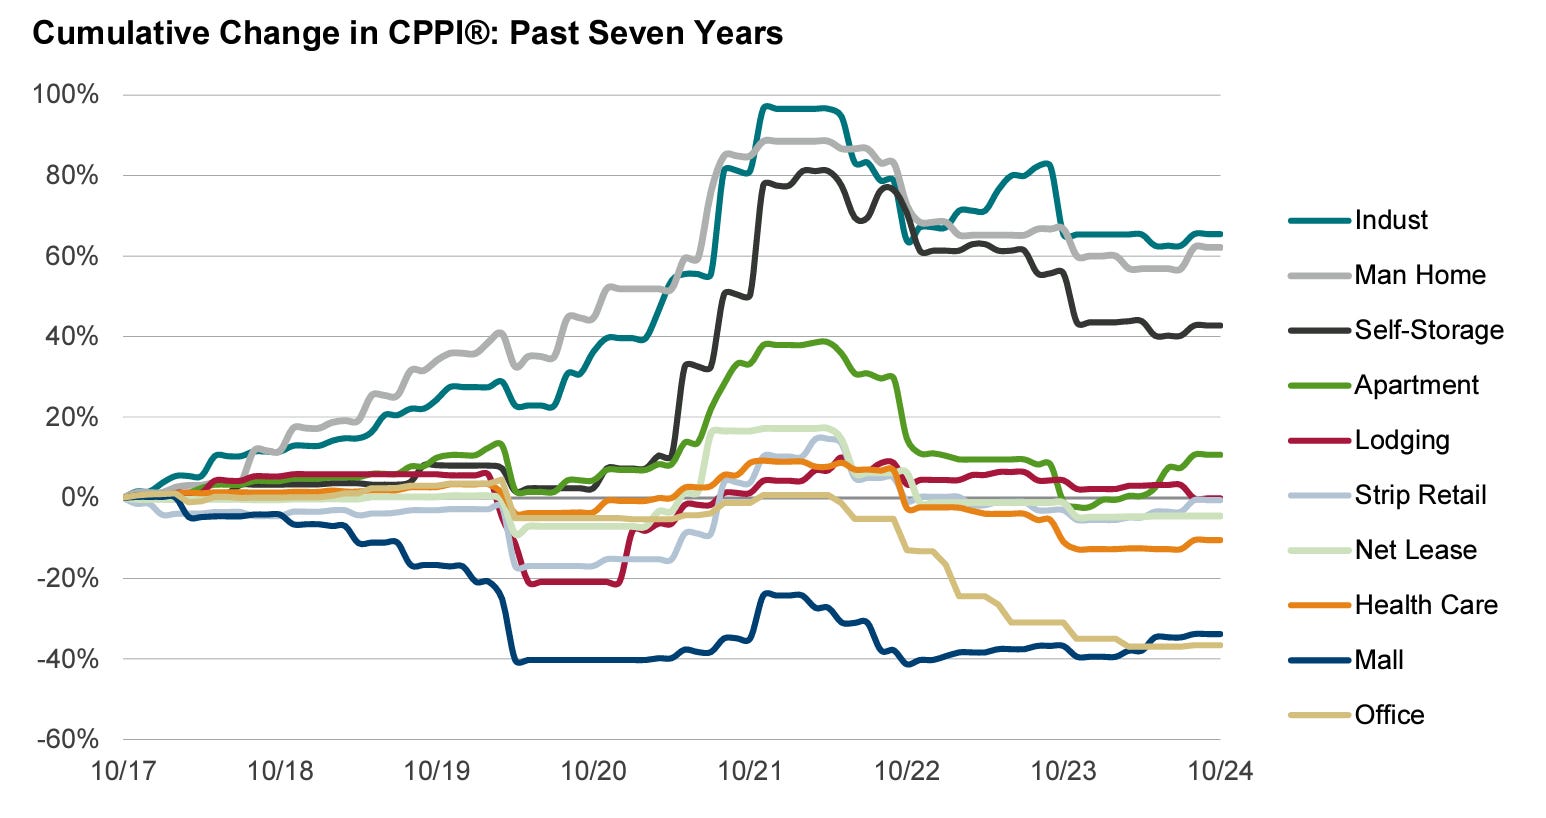
The following (somewhat messy) chart is publish by Green Street, a leading provider of commercial real estate data and market analysis, and this visualization of cumulative price changes can be used to identify peaks and troughs in value.
For example, eyeballing the chart tells is that prices of public storage properties (black line) peaked towards the end of 2021, drifted down, and have been moving sideways for the past year.

Meanwhile, the stock of Public Storage (NYSE: PSA) bottommed out last October and has rallied more than 40%.

Stock market investors are betting on storage, even if the value of the underlying properties haven’t reflected the same optimism.
Returning again to that messy chart, multifamily values (dark green line) recently began to rally, but are well off the highs set back in the 2021/22 ZIRP (Zero Interest Rate Policy) heyday.
Stock market investors however, are decidedly more optimistic.
Avalon Bay (NYSE: AVB), a developer and owner of higher end apartment complexes around the country, is within 10% of its all-time high.

And given that the high was set back in 2022 before interest rates began to rise, adjusting for the cost of financing, it appears that apartment investors are feeling more optimistic than ever.
There is of course, no thing as a free lunch, and the predictive power of REIT stocks is no different.
Returning to industrial giant Prologis, the Green Street price index and Prologis stock have moved pretty much in lock step.
Industrial (turquoise line) peaked in October 2021 and have been moving down-sideways ever since.

Same with PLD, but I’m keeping an eye on it as an indicator of whether demand is catching up with slowing deliveries, which could indicate that sector is going to boom once again.

Another benefit of REIT pricing data is that during times of market dislocation when there are few individual property sales, we can look to the public markets for clues about how sectors are likely to fare when property markets start moving again.
In fall 2020 during the depths of the pandemic, some partners and I put together a simple analysis of REIT performance to assess how property sectors were faring even though there were few sales.

Expectedly, retail and office were hurting badly when we looked at year-to-date data (including the Covid collapse in prices). However, after the March 2020 lows, retail rebounded nicely, which we found surprising.
As it turns out retail has performed stronger than expected post-Covid, which REIT pricing was suggesting even while the pandemic was still in full effect.
There is of course much deeper analysis needed to know whether any individual REIT is a good investment, since ultimately the value of the company is derived from the expected future value of the underlying assets that the REIT owns.
But in a few minutes bouncing back and forth between private market value and REITs can be a terrific temperature check for any real estate market sector.